


Population Distribution
Describe and explain the physical and human factors affecting population distribution at the global scale
Population Distribution
Describe and explain the physical and human factors affecting population distribution at the global scale
Half of Canada’s population lives below the red line. What might be the physical (natural) and human reasons for this?

TASK 1: DEFINING POPULATION DENSITY AND DISTRIBUTION
Define the following terms into your notes.
population distribution
The pattern of where people live. World population distribution is uneven. Places which are sparsely populated contain few people. Places which are densely populated contain many people.
population density
The number of people per square km
TASK 2: DESCRIBING GLOBAL POPULATION DISTRIBUTION
Population distribution refers to the pattern of where people live across the earth's surface.
Study the map below and describe the global distribution of:
areas with > 500 people per square km population
areas with < 2 people per square km
To do this, identify and name the continental regions. Include data in your answer.
Global population density map (Source)
TASK 3: REASONS FOR GLOBAL POPULATION DISTRIBUTION
Write the following factors into your notes.
Population distribution is influenced by a variety of physical and human factors that vary in their importance and impact across different regions of the world.
Physical Factors:
Climate: Extreme temperatures, lack of rainfall, and other climate-related factors can limit human settlement in certain areas. For example, the harsh conditions in the Sahara Desert make it difficult for people to live there.
Topography: Mountainous or hilly areas can make it difficult to build infrastructure and cultivate crops, reducing the attractiveness of these areas for human settlement.
Water Resources: Access to freshwater sources is critical for human survival, so areas with abundant water resources tend to have higher population densities. This is particularly evident in river valleys, such as the Nile or Amazon River.
Natural Resources: Areas with abundant natural resources like minerals, oil, and timber can attract people seeking work and economic opportunities.
Human Factors:
Economic Opportunities: The availability of jobs, particularly in urban areas, can attract people looking for work and lead to higher population densities.
Political Stability: Areas with stable and effective governance tend to have higher population densities, as people feel safer and more secure in those places.
Culture and Language: Cultural and linguistic ties can influence population distribution, as people tend to prefer living in areas where they feel a sense of community and belonging.
Infrastructure: Access to transportation networks and other types of infrastructure can facilitate human settlement in certain areas.
TASK 4: EXAMPLES OF GLOBAL POPULATION DISTRIBUTION
Explore the world population density map below and locate named examples for each of the factors above. Take screenshots of examples and add these to a document, explaining the reasons for high/low density per square km.

Click on the map above to explore global population density and distribution
TASK 5: POPULATION DISTRIBUTION AT THE NATIONAL SCALE
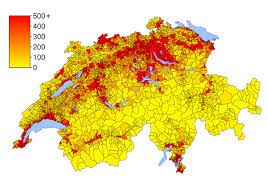
Population density map of Switzerland
Download a population density map for your country
Label this to explain the physical and human reasons for areas with high or low population density
Share your map and explain in small groups
Economic Development Patterns
Examine global patterns and classification of economic development
Economic Development Patterns
Examine global patterns and classification of economic development
Traditionally, a country’s level of development was made by looking at the economy, and had a dichotomous focus of rich/poor or developed/developing.
In what ways is this an outdated way of viewing human development?

The Brandt Line (Source)
TASK 1: COMPARING MEASURES OF INCOME
Income is the main method of measuring a country’s economic development. However, the way that income is calculated can vary depending on a variety of factors.
Watch the video and compare and contrast GDP, GNP and GNI.
TASK 2: WHY GDP IS NOT A GOOD MEASURE OF WELL-BEING
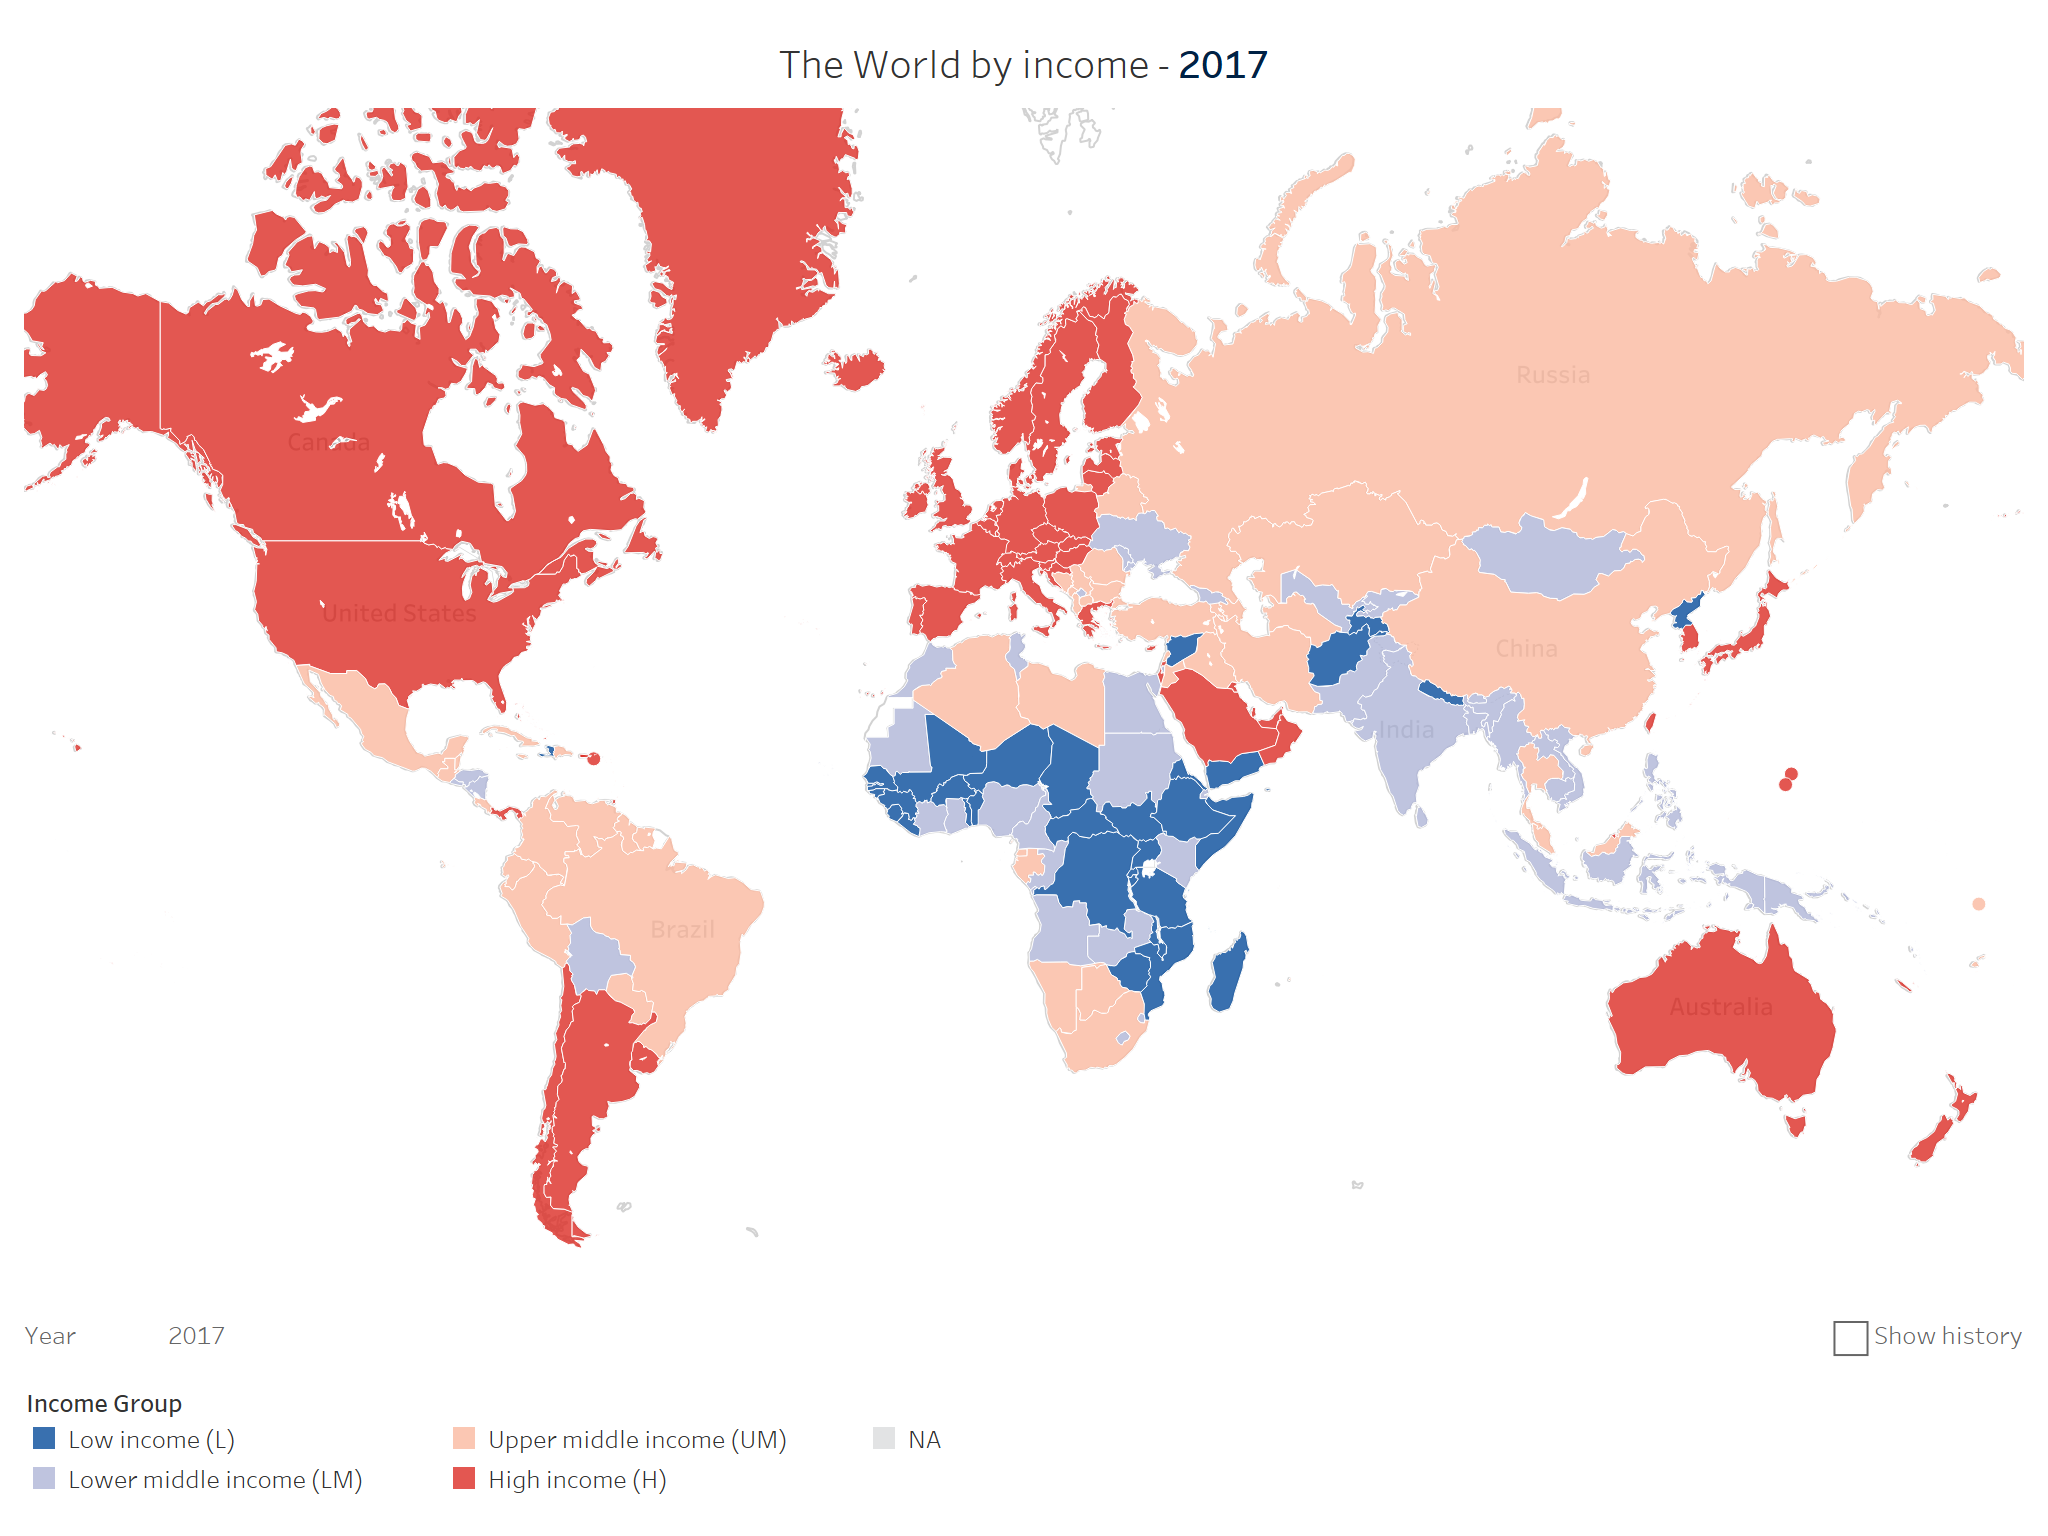
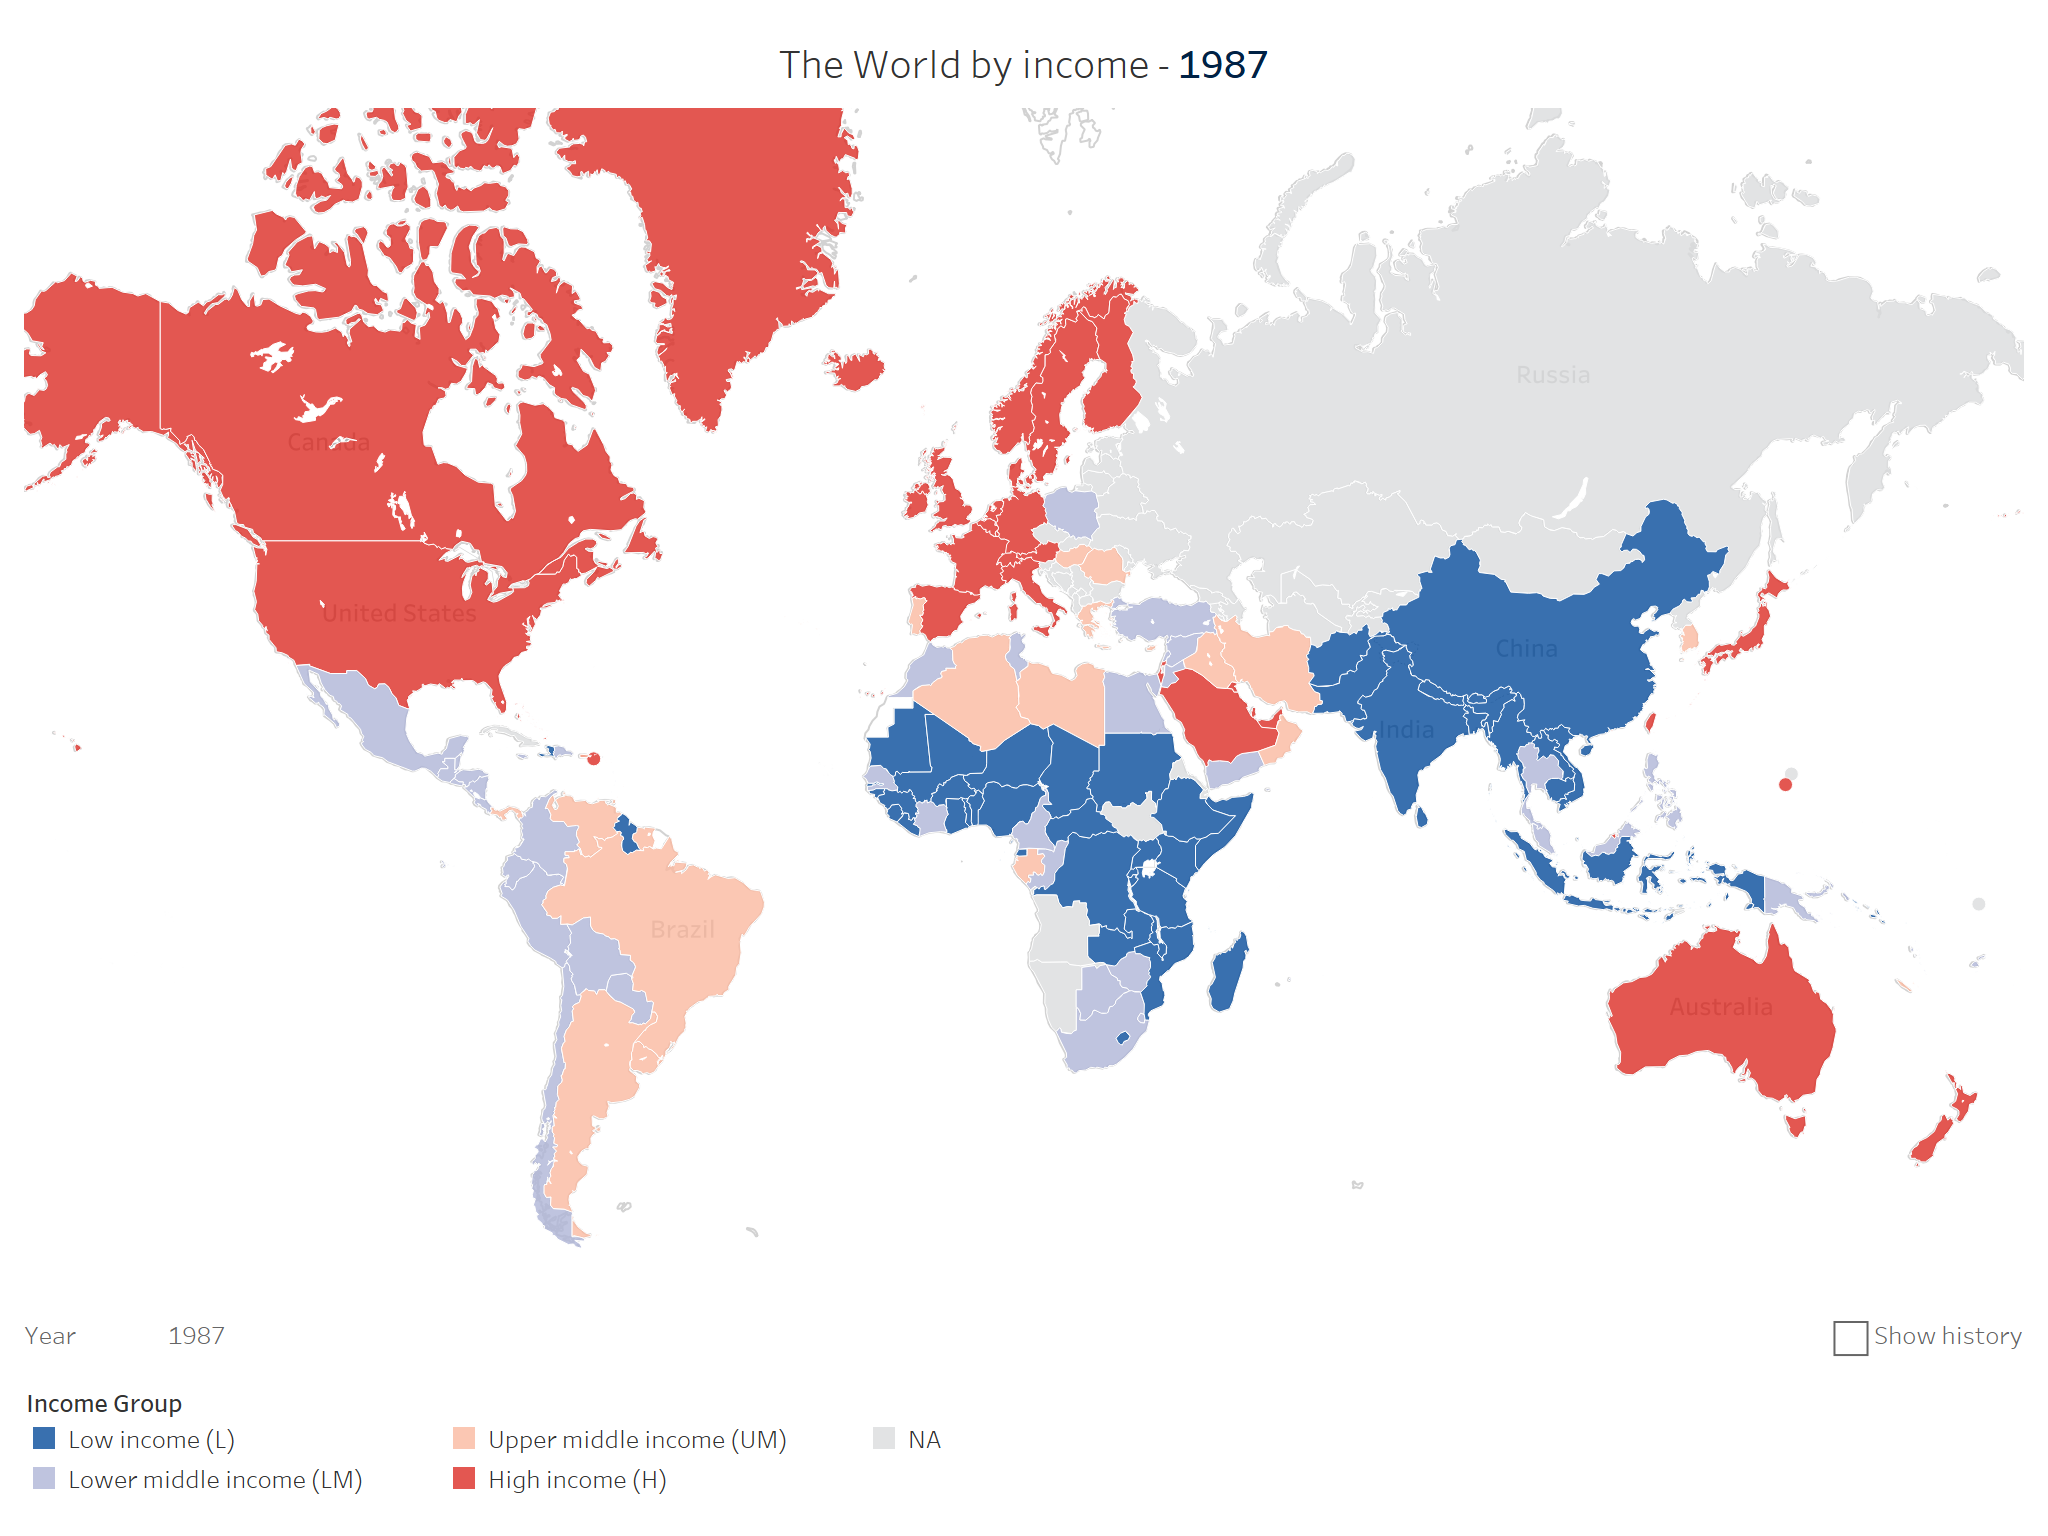
TASK 3: HIGH, LOW AND MIDDLE INCOME COUNTRIES

The World Bank assigns the world's economies into four income groups — high, upper-middle, lower-middle, and low.
This is calculated using GNI per capita and represented by US Dollars.
Describe how the global pattern of income changed between 1987 and 2017
GLOBAL DISTRIBUTION OF COUNTRIES BY INCOME
Make a world map showing the distribution of countries by income level.

TASK 4: CHANGES IN INCOME CLASSIFICATION OVER TIME
Examine the graph below and describe how each country’s economic classification changed over time. Use years and GNI per capita data in your answer.

Population & Economic Development: National Scale
Population distribution and economic development at the national scale, including voluntary internal migration, core-periphery patterns and megacity growth.
Two detailed and contrasting examples of uneven population distribution.
Population & Economic Development: National Scale
Population distribution and economic development at the national scale, including voluntary internal migration, core-periphery patterns and megacity growth.
Two detailed and contrasting examples of uneven population distribution.
Knowledge of the spatial distribution of populations at finer spatial scales is of significant value and fundamental to many applications such as environmental change, urbanisation, regional planning, public health, and disaster management¹.
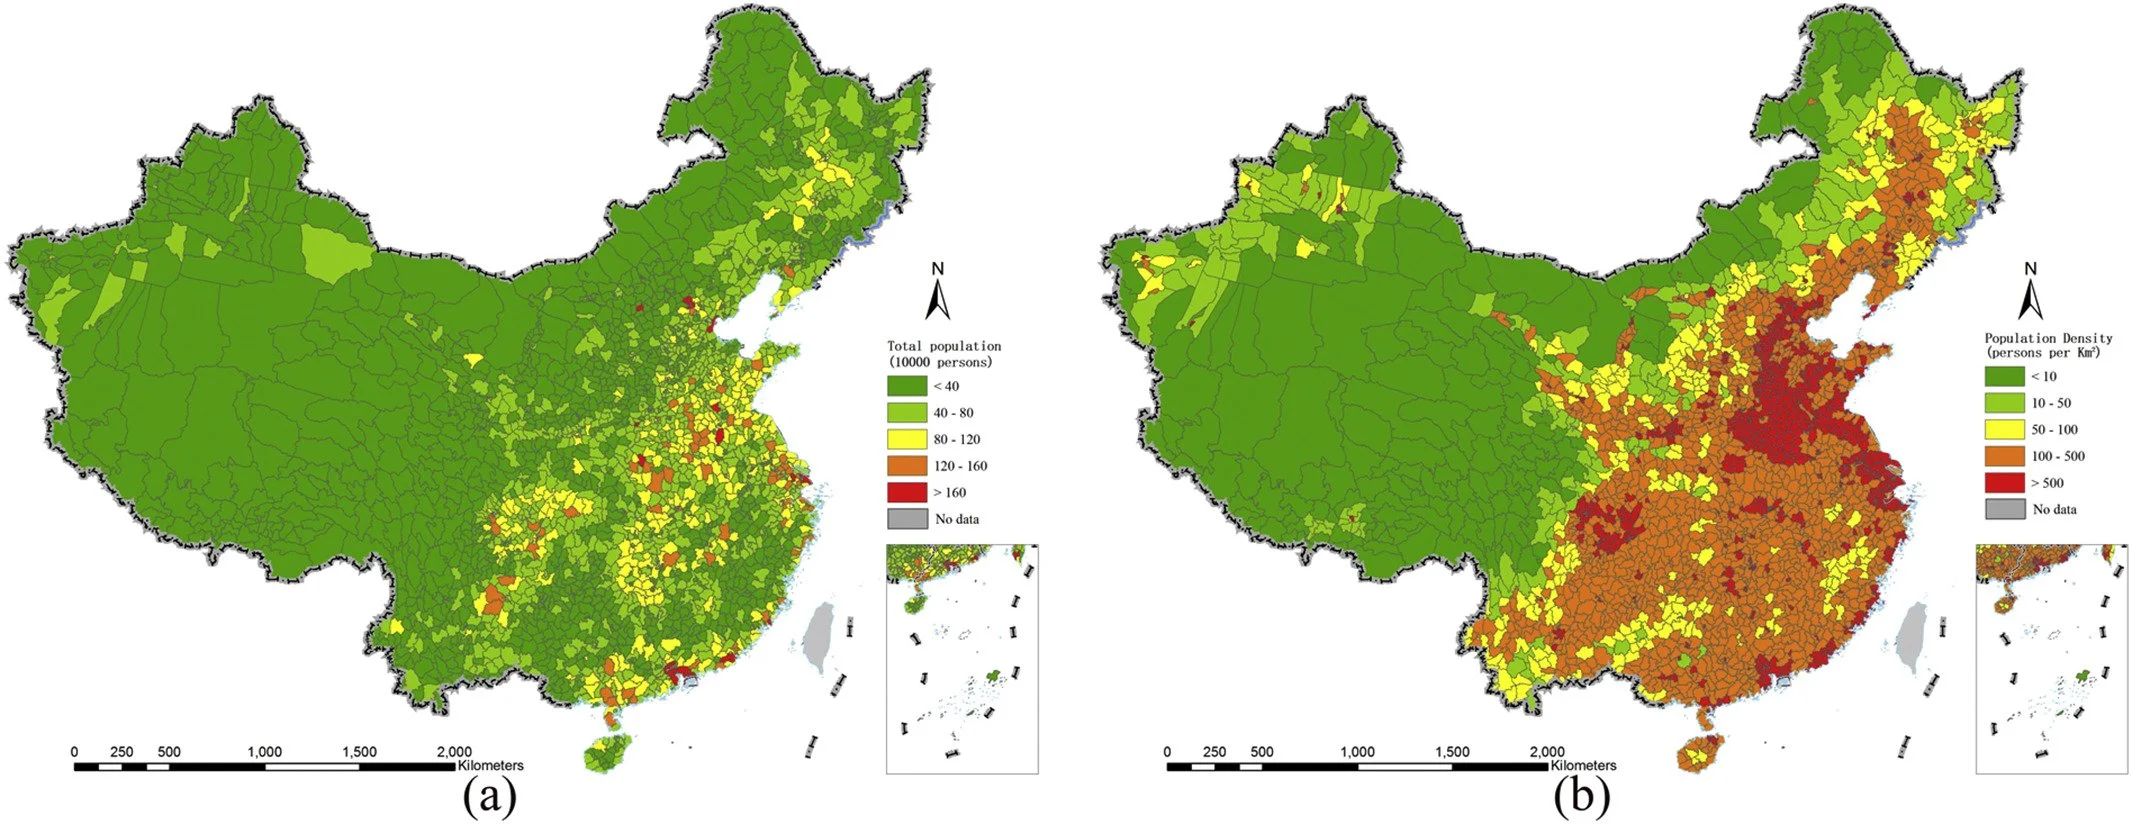
POPULATION DISTRIBUTION IN CHINA
Riva, Alessandra & Hénaut, Alain. (2015). Water Resources in China. 10.13140/RG.2.1.4271.3767.
China is the most populated country in the world and its national population density (137/km2) is very similar to those of countries like Denmark. However, the overall population density of China conceals major regional variations.
In 2002, about 94% of the population lived east of the Heihe–Tengchong Line, which makes up only 43% of the total land area, which leads to much higher average density (about 280/km2, a little less than Japan).
Broadly speaking, the population is concentrated in the east of the country. The most densely populated areas included the Yangtze River Valley (of which the delta region was the most populous), Sichuan Basin, North China Plain, Pearl River Delta, and the industrial area around the city of Shenyang in the northeast.
Population is most sparse in the mountainous, desert, and grassland regions of the northwest and southwest. In the Inner Mongolia Autonomous Region, portions are completely uninhabited, and only a few sections have populations denser than 10 people per km2. The Inner Mongolia, Xinjiang, and Tibet autonomous regions and Qinghai and Gansu comprise 55% of the country's land area but in 1985 contained only 5.7% of its population².
VOLUNTARY INTERNAL MIGRATION IN CHINA
Economic development and rapid urbanisation have spurred massive internal migration in China, largely from the countryside to towns and cities, by individuals in search of jobs and higher wages. Official statistics place the number of internal migrants in China at over one-tenth of China’s 1.3 billion people³.
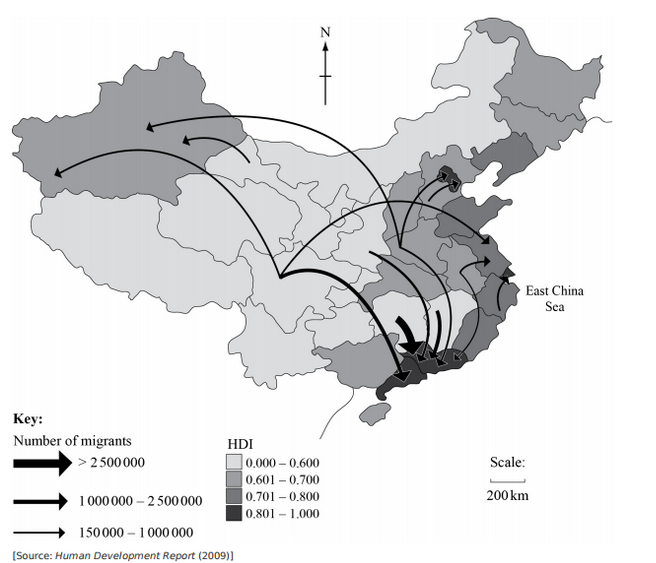

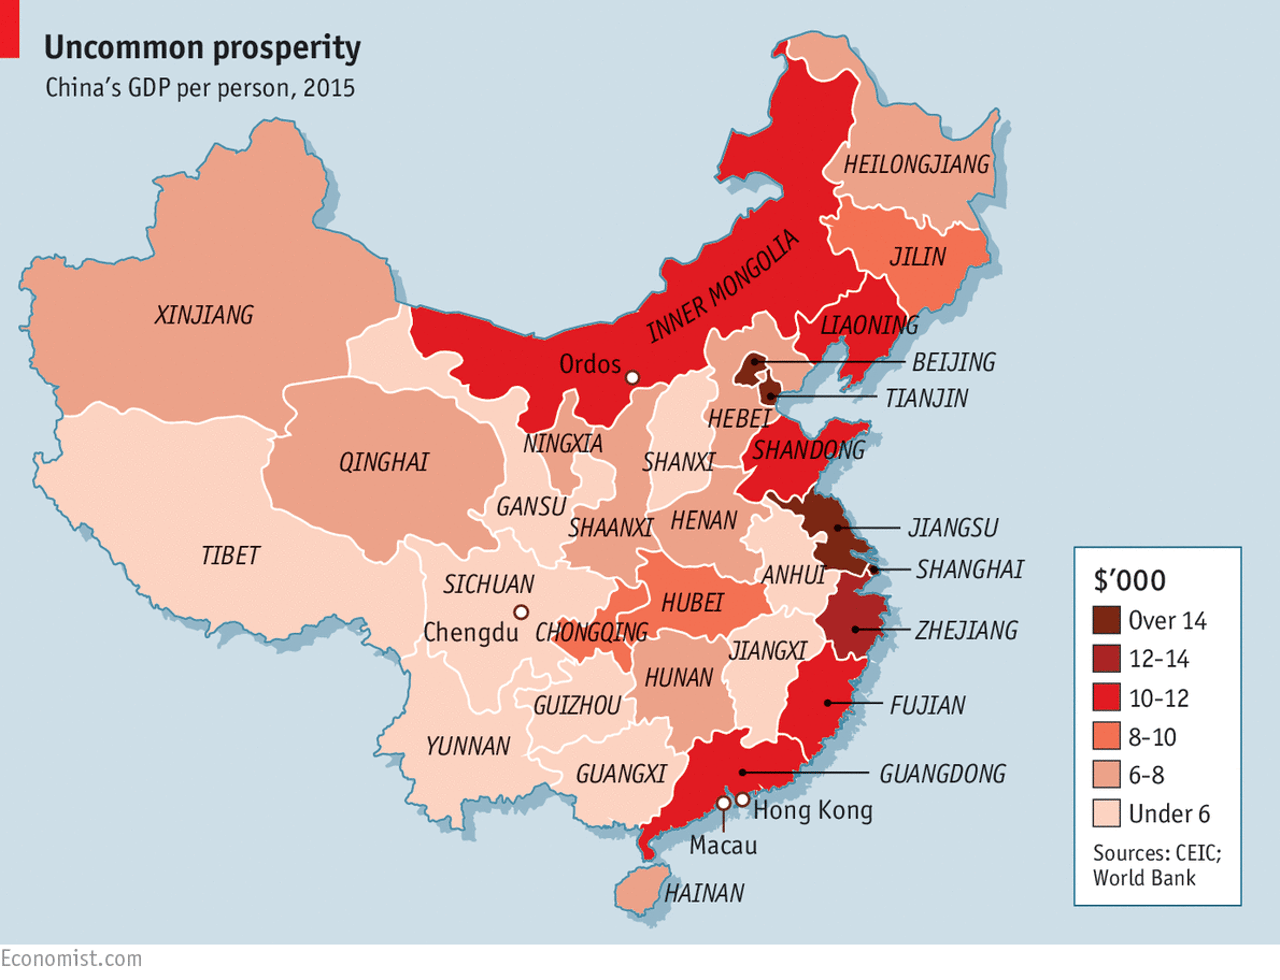
CORE-PERIPHERY PATTERNS IN CHINA

POPULATION DISTRIBUTION IN SWITZERLAND
Switzerland had a population of 8.57 million as of mid-2019. More than 75% of the population live in the central plain, which stretches between the Alps and the Jura Mountains and from Geneva in the southwest to the High Rhine and Lake Constance in the northeast.
INTERNAL MIGRATION & CORE-PERIPHERY PATTERNS IN SWITZERLAND

Internal migration in Switzerland follows patterns of deconcentration and counter-urbanisation in the second half of the last century. There is a trend of moving away from large densely populated districts and towards smaller, more sparsely populated and medium sized districts.
Suburbanization and counter-urbanization were occurring and core urban centers were growing slower than smaller urban and rural areas. During the last decade of the 20th century, most major (core) cities lost population to smaller urban and rural areas. The cantons of Aargau, Vaud, Ticino, Thurgau, and Fribourg were net gainers from internal migration, while Basel-City, Grison, Bern, Geneva, and St. Gall were the biggest losers.
MEGACITY GROWTH
Bibliography
S Kahsai, M., & V Schaeffer, P. (2010). Deconcentration, counter-urbanization, or trend reversal? The population distribution of Switzerland, revisited. The Open Urban Studies Journal, 3(1).