


Population Pyramids
Identify and give reasons for and implications of different types of population structure as shown by age/sex pyramids of countries at different levels of economic development
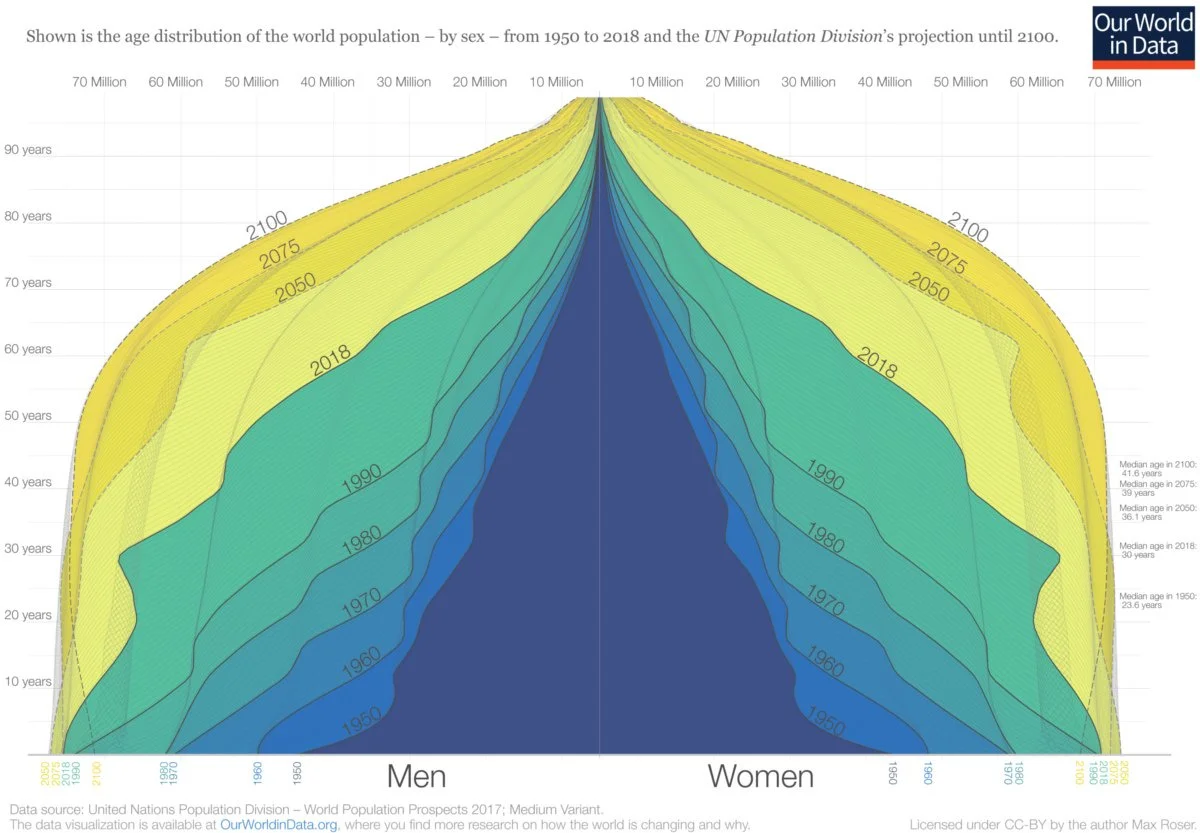
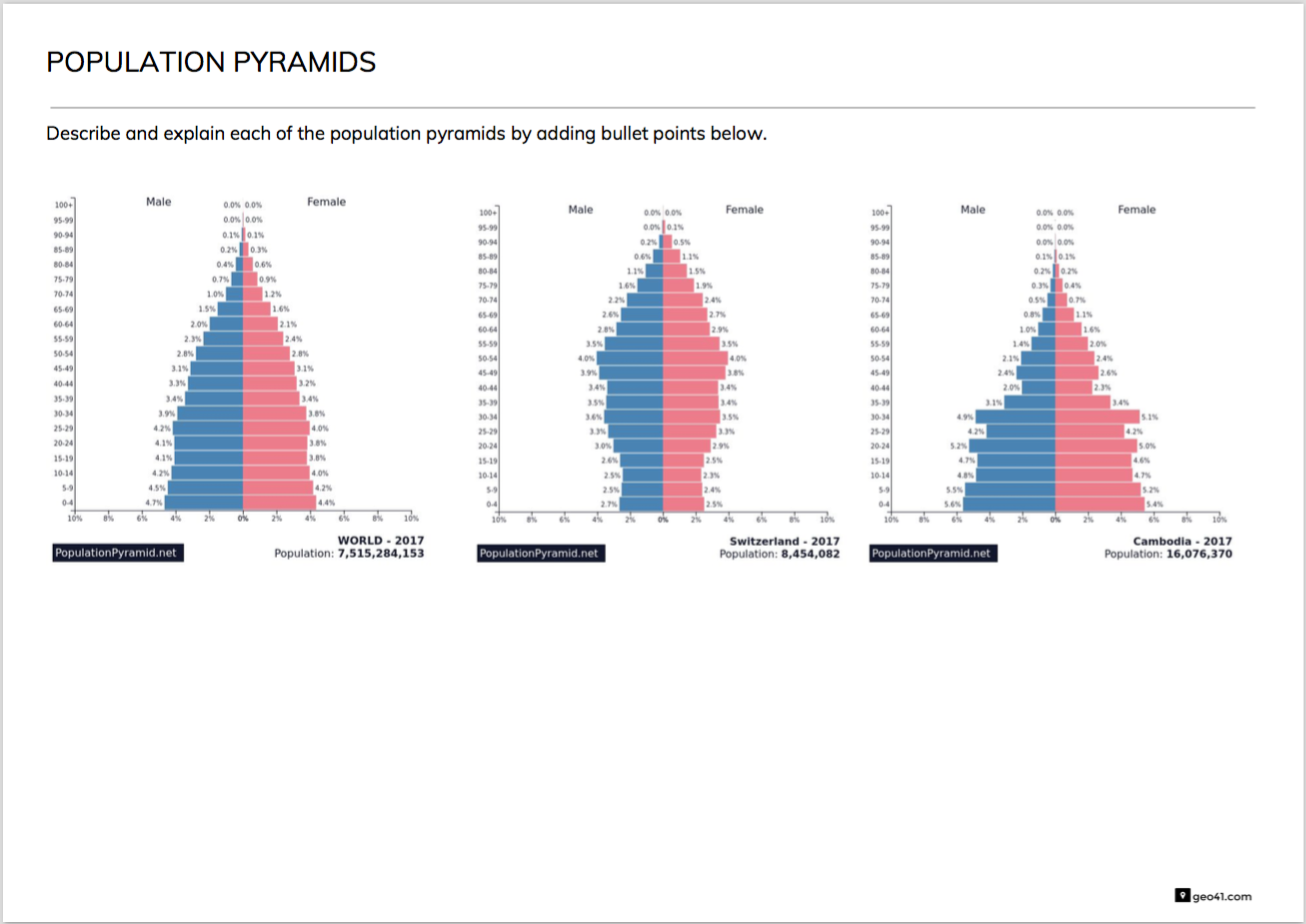
Population Pyramids
Identify and give reasons for and implications of different types of population structure as shown by age/sex pyramids of countries at different levels of economic development
World
Switzerland
Cambodia
Youthful Populations
Examine the impacts of a youthful population structure
Youthful Populations
Examine the impacts of a youthful population structure
Study the population pyramid for Cambodia below.
What does this population pyramid tell us about:
birth rates death rates infant mortality migration gender balance
2011 (Source)
CASE STUDY: YOUTHFUL POPULATION IN CAMBODIA
Task
Use a pencil to draw a simple sketch map showing Cambodia’s location in South East Asia. Label neighbouring countries. Draw a box around your map.
Click to open
Read the infographic and create a factfile for Cambodia in your notes.
Add images to illustrate each of the points.
Highlight key information.
Write a paragraph introducing Cambodia and its youthful population.
Watch the start of this documentary and note the causes and positive and negative impacts of Cambodia’s youthful population.

TASK
Read p 3 “Foreword”
List the problems associated with Cambodia’s youthful population
In groups, read one of the following sections and summarise the main challenges on poster paper:
Economic & Social - p14
Employment - p15
Education - p15-16
Health - p16-17
Vulnerability - p17-18
Participation & Rights - p18
DEMOGRAPHIC DIVIDEND
Demographic dividend refers to the economic growth potential that can result from shifts in a population’s age structure, mainly when the share of the working-age population (15 to 64) is larger than the non-working-age share of the population (14 and younger, and 65 and older)".

In other words, it is “a boost in economic productivity that occurs when there are growing numbers of people in the workforce relative to the number of dependents.”
In order for economic growth to occur the younger population must have access to quality education, adequate nutrition and health including access to sexual and reproductive health.
Ageing Populations
Describe the consequences (benefits and problems) of ageing populations
Ageing Populations
Describe the consequences (benefits and problems) of ageing populations
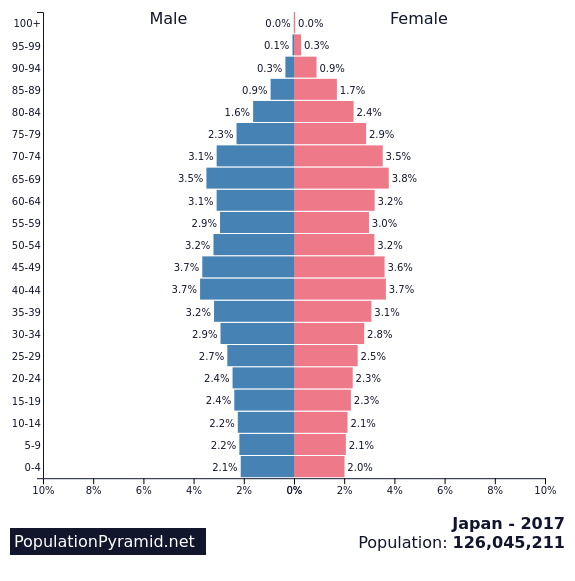
TASK 1: Population data for Japan
Calculate the percentage of people aged 65+ from the pyramid
Using the figure for total population, calculate the total number of people aged 65+ in Japan

DEPENDENCY RATIOS
TASK 2: Summarise what dependency ratios are and how they are calculated
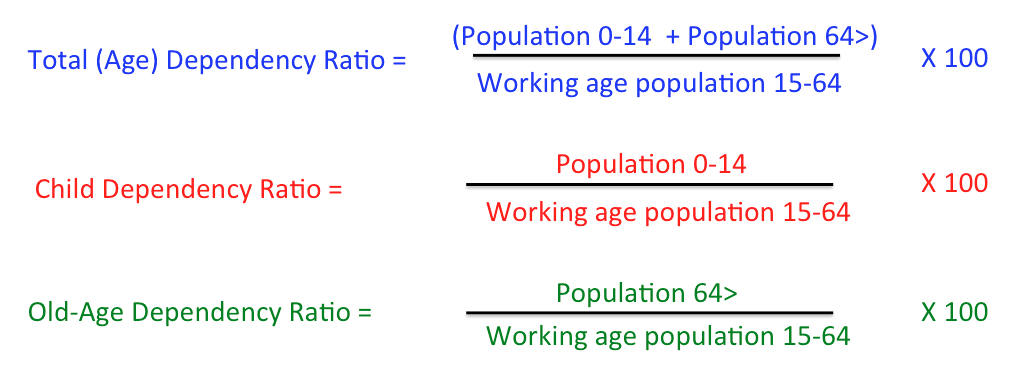
The dependency ratio is an age-population ratio of those typically not in the labour force (the dependent part ages 0 to 14 and 65+) and those typically in the labor force (the productive part ages 15 to 64). It is used to measure the pressure on productive population and is shown as a percentage %.
TASK 3: Using the data below calculate the total age dependency ratios, child dependency and old-age dependency for Switzerland and Russia.
RUSSIA
Population: 142,257,519 (2017)
0-14 years: 24,352,817
15-64 years: 97,593,388
65 years and over: 20,311,314
SWITZERLAND
Population: 8,236,303 (2017)
0-14 years: 1,248,503
15-64 years: 5,493,092
65 years and over: 1,494,708
EFFECTS OF A HIGH OLD-AGE DEPENDENCY RATIO
TASK 4: Explain four impacts of a high dependency ratio.
Lower Tax Revenues - retired people pay lower income tax. Therefore, the working age population has a greater responsibility to pay tax.
Higher Government Spending - the government is committed to paying a state pension and related benefits such as a minimum income guarantee. There are also greater demands for indirect spending on retired people. People over 65 are more likely to require treatment by the NHS. Therefore, there are greater demands placed on government spending by a rise in the dependency ratio.
Higher tax rates - because of reduced government finances, the working population pay more taxes. This could lead to people working less and reducing disposable income (savings). The government may be forced to collect more revenue from indirect taxes or wealth taxes.
Lower pension funds - because of the rising percentage of retired people, pension funds are having to stretch further than before. Many pension funds haven’t planned for the rapid rise in the dependency ratio. Combined with the credit crisis and low interest rates, the average income retired people can expect has fallen.
Pressure to raise retirement age - because of the increased cost of pensions there is pressure to raise the retirement age in both the private sector and public sector. Tesco’s recently announced it will be the first private firm in the UK to raise its pension age to 67. This is an attempt to reign in the costs and meet the pension shortfall they currently have.
Inequality - raising the state pension age will have different effects. Some people with a substantial private pension will not really be affected. They can still choose to retire when they want. However, others with no or minimal state pension will have to work longer.
CASE STUDY: JAPAN'S AGEING, DEPENDENT POPULATION
TASK 5: Describe the changes to Japan’s population structure outlined in the pyramids below

TASK 6: Watch the video and list the opportunities and challenges
EXAM PRACTICE
With reference to named examples, examine the consequences (benefits and challenges) of an ageing population [7 marks]
The best answers will:
include frequent reference to facts, data and examples
compare both the benefits and challenges
come to a clear conclusion
Population Policy
Describe and evaluate pro-natalist and anti-natalist population policies
Population Policy
Describe and evaluate pro-natalist and anti-natalist population policies
Fertility rates in many high income countries are falling below the replacement level of 2.1 children per woman. Suggest 3 reasons why this might be a problem for the future of countries like Switzerland.
PRO-NATALIST POLICY
Pro-natalist policies attempt to increase fertility rates by offering incentives to families for having more children. Suggest three ways that governments could
FRANCE’S PRO-NATALIST POLICY (Source)
In 1939, the French passed the “Code de la famille”, a complex piece of pro-natalist legislation. The pro-natalist methods in the policy included:
Offering cash incentives to mothers who stayed at home to care for children.
Subsidising holidays.
Banning the sale of contraceptives (repealed in 1967).
Incentives offered in the policy included:
Payment of up to 1064 EUR to couples having their third child.
Generous maternity grants.
Family allowances to increase the purchasing power of three child families.
Maternity leave on near full pay for 20 weeks for the first child to 40 weeks or more for the third child.
100% mortgage and preferential treatment in the allocation of three bedroom council flats.
Full tax benefits to parents until the youngest child reaches 18.
30% fare reduction on all public transport for three child families.
Pension schemes for mothers/housewives.
Child-orientated development policies e.g. provisioning of creches, day nurseries etc.
Depending on the family’s income, childcare costs from virtually nothing to around €500 a month for the most well off of families.
Nursing mothers are encourage to work part-time or take a weekly day off work.
Create a poster campaign to encourage people to have a 3rd child.

Your poster should include at least 6 incentives from France’s pro-natalist policy designed to increase fertility rates.
Include images and facts which help to explain the incentives.